|
hosted at (dreamhost.com) | |
|
local
me
livejournal
pictures of food resume vox yelp etc.
news
reference
shops
work
|
Monitoring network traffic with iptraf and rrdtool Introduction One of a network administrator's most important tasks is to monitor network activity. mrtg is by far the most popular tool to do this. But sometimes looking at straight network traffic isn't enough — sometimes you need to profile the traffic more precisely to figure out what's happening. To do this, we'll use iptraf and rrdtool. (As an aside, yes you can use ntop instead of iptraf. See http://www.ntop.org/RRD/.) How-to 0. Install iptraf and rrdtool on your computer. How this is exactly done is rather out of scope right here. For me (using debian linux), it was a matter of running
from the command line.
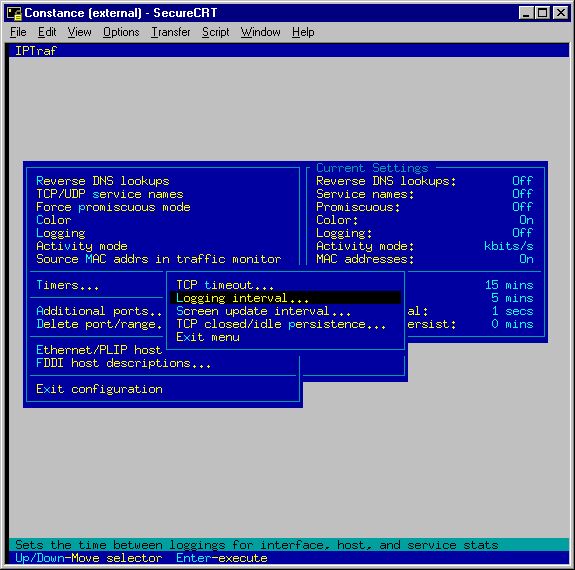
1. Run iptraf from the command line to configure it through the curses interface. Since we'll be reading the statistics every five minutes, you definitely want to change the log interval to five minutes. Also, if you want iptaf to monitor any non-privileged ports (ports above 1023, bindable by non-root users, such as gnutella (tcp/6346) or xpilot (tcp/15345)), you need to add them here. You can change other things — what/where the logfile is, units of measure, etc. — it's all pretty self-explanatory. Look at the manpage or status bar (second line from the bottom while iptraf is running) for help. Make sure that the "Service names" option is "Off", otherwise you'll need to use getservbyname(3) in the perl script below. While you're here, check out what iptraf'll be tracking. From the main menu, choose 'Statistical breakdowns' » 'By TCP/UDP port' » 'eth0' (or whatever interface you want.) Neat, huh? 2. Start running iptraf in the background with the command:
where you replace eth0 with whatever interface you're trying to profile. The -s flag tells iptraf to gather statistics on the services being used. I'm not sure what you would do if you want to look at two interfaces at once. If anyone knows, please drop me a line. Check to make sure the logfile is there. On my computer it's at /var/log/iptraf/tcp_udp_services-eth0.log. It's also owned by root and has fairly restrictive permissions so I chmod'd the directory to 750, the log files to 640 and chown'd them both to root.adm and added myself to the adm group which let me read the data and update the database as a non-superuser. After five minutes, you should see something like this in the log (the records are each a single line, broken here for clarity): Sun Jan 27 00:35:22 2002; ******** TCP/UDP service monitor started ******** *** TCP/UDP traffic log, generated Sun Jan 27 00:40:22 2002 TCP/22: 4645 packets, 4302156 bytes total; 3027 packets, 4198328 bytes \ incoming;1618 packets, 103828 bytes outgoing TCP/119: 11307 packets, 10180509 bytes total; 4124 packets, 223511 bytes \ incoming; 7183 packets, 9956998 bytes outgoing TCP/80: 207 packets, 68184 bytes total; 85 packets, 5556 bytes incoming; \ 122 packets, 62628 bytes outgoing Running time: 300 seconds It's not too pretty — by which I mean it's easy enough for a human to read, but a little more difficult for a computer. Still, that's what we'll have to parse. But later! First, we … 3. … set up the rrd (round-robin database). This is done with the rrdtool command. See the man pages for rrdtool and rrdcreate for details. Alex van den Bogaerdt's RRDtool tutorial is a good place to learn more, too. I used an mrtg-ish database with about two days for five minute samples, two weeks of thirty minute samples, two months of two hour samples and two years of one day samples. On my machine this makes a file that's about 500k large. One nice thing about the rrd format, though, is that it will never, ever grow and larger, no matter how many times it's updated or long it's used.
        rrdtool create tcp_services.rrd              \
                DS:22_in:COUNTER:600:U:12500000      \
                DS:22_out:COUNTER:600:U:12500000     \
                DS:25_in:COUNTER:600:U:12500000      \
                DS:25_out:COUNTER:600:U:12500000     \
                DS:80_in:COUNTER:600:U:12500000      \
                DS:80_out:COUNTER:600:U:12500000     \
                DS:119_in:COUNTER:600:U:12500000     \
                DS:119_out:COUNTER:600:U:12500000    \
                DS:443_in:COUNTER:600:U:12500000     \
                DS:443_out:COUNTER:600:U:12500000    \
                RRA:AVERAGE:0.5:1:600                \
                RRA:AVERAGE:0.5:6:700                \
                RRA:AVERAGE:0.5:24:775               \
                RRA:AVERAGE:0.5:288:797              \
                RRA:MAX:0.5:1:600                    \
                RRA:MAX:0.5:6:700                    \
                RRA:MAX:0.5:24:775                   \
                RRA:MAX:0.5:288:797
This database saves input and output statistics for five tcp ports: 22 (ssh), 25 (smtp), 80 (http), 119 (nntp) and 443 (https). If there are others you want to monitor, you can add more DS (data sources). My convention here is to call each data source '{port}_{direction}'. The max rate is set to 12.5MB/s (or 100Mbs — I don't ever expect to reach this; it's just a little sanity check on the incoming data.) On my computer, all of the rrd's are in the /var/lib/rrd directory. 4. Set up the database update script. I use a simple perl script (see the Notes if you're using iptraf v2.7.0) that I hacked up, but you can use whatever you want (perl, python, shell, etc.) It works by reading the log down to the point where the database was last updated, and then it starts parsing. Note if you're going to do-it-yourself, rrd has a couple of convenient perl bindings you can use. Use cron to update the database every five minutes. I put all of my rrd update scripts in the /var/lib/rrd/rrd.d directory. This lets me use run-parts to run everything in the directory every five minutes, which is very convenient.
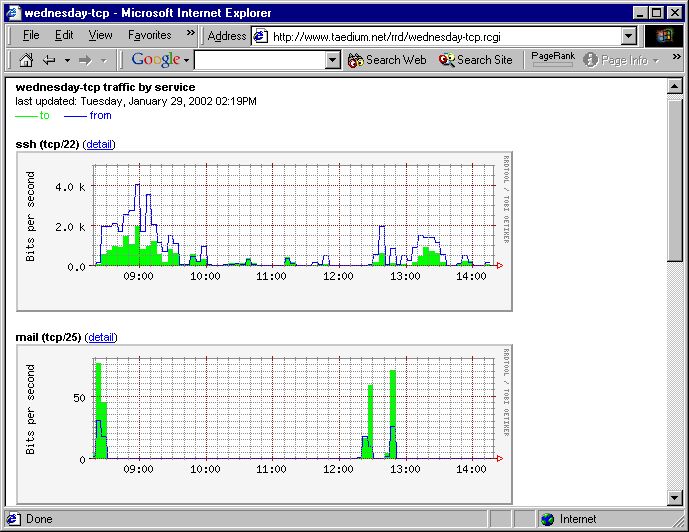
5. Set up the rrdcgi web interface. A basic recipe for a graph is something like this: See the rrdgraph manpage or Alex van den Bogaerdt's CDEF tutorial for more detail, but what the above rrdcgi command essentially does is make a graph with the data from the tcp_services.rrd file starting 6 hours, 5 minutes ago and ending 5 minutes from now. Two data sources are used: 22_in and 22_out (the DEF statements). The values are multiplied by 8 (the CDEF statements) to change the rate from bytes to bits per second. Finally the scaled values are graphed, in_bits as a green area and out_bits as a blue line. The other ports are more-or-less the same. Here's my tcp_services.rcgi file. (If your browser doesn't properly display this file, you might need to save it to disk and open it with your favorite editor.) Note if you're using apache you'll probably need to add the line
to your .htaccess or /etc/httpd/httpd.conf so that the script is executed as a cgi. 6. Wait a couple of hours for the data to be collected, and then you're done — your work well-rewarded by lots of pretty (and useful!) graphs. Notes Feb. 2004: Page put back up! Nov. 2002: Jon B and Damien Mascord almost simultaneously found the problem with iptraf logging service names instead of port numbers. Jul. 5, 2002: Jeremy Whistance points out that iptraff v2.7.0 uses a slightly different logfile format than iptraf v2.5.0. A version of the perl script for 2.7.0 is available. Also, iptraf's logfile should be rotated regularly (I do it daily) so that the file does not get too large. Actually, there's probably a way to get iptraf to only the log the ports we're looking at, but I don't know what it is (yet!) Jul. 4, 2002: Someone asked which versions of iptraff and rrdtool I'm currently using. As far as I know, these instructions work for all modern versions of both iptraf and rrdtool, but I'm specifically using iptraf v2.5.0 and rrdtool v1.0.35 (the latest packages from Debian Woody.) Feb. 25, 2002: In the original perl script, there was a bug in the _parse() function. Non-TCP traffic should have been filtered out, but it was not. This meant that if both TCP and UDP traffic hit the same port, the data would be overwritten. |
|
|
Home |